Echarts环形图、饼图径向渐变示例-灵析社区

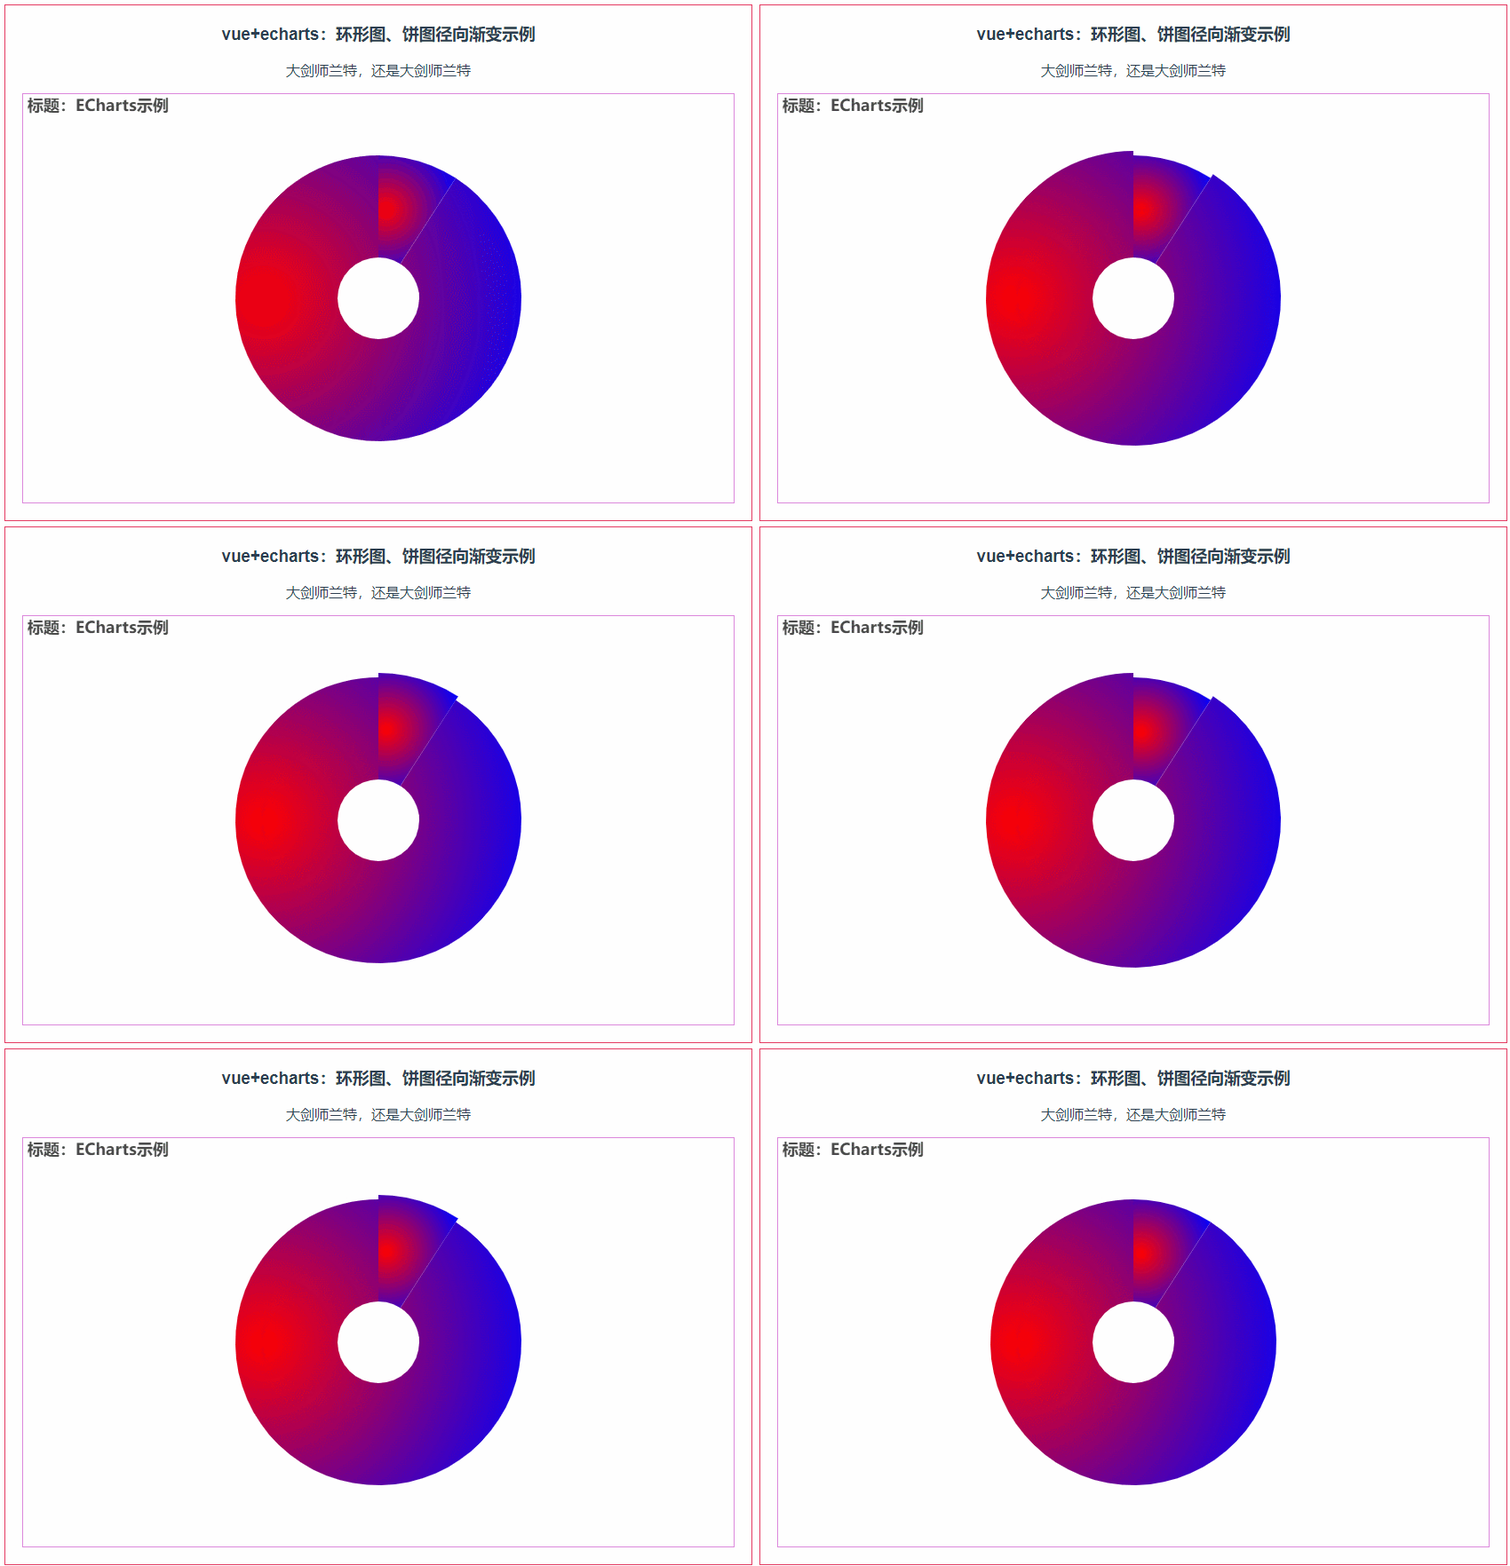
在上一篇文章中已经讲过 ECharts线性渐变色示例演示(2种渐变方式),这里做了环形图,饼图的一个径向渐变的示例演示,这里type: ‘radial’,想,y、x、z需要设置相应的数值,见示例代码中的注释。
径向渐变: radial
- type:‘radial’,径向渐变
- x,y,代表圆心,数值范围 0-1;
- r,代表半径,数值范围 0-1;
- colorStops,类似颜色线性梯度,数值范围 0-1;
- global,默认false
示例效果

示例源代码(共80行)
/*
* @Author: 还是大剑师兰特(CSDN)
* @下面源代码版权归还是大剑师兰特所有,可供学习或商业项目中借鉴,未经授权,不得重复地发表到博客、论坛,问答,git等公共空间或网站中。
* @Email: 2909222303@qq.com
* @First published in CSDN
* @First published time: 2023-02-02
*/
<template>
	<div class="container">
		<h3>vue+echarts:环形图、饼图径向渐变示例</h3>
		<p>大剑师兰特,还是大剑师兰特</p>
		<div id="vue-echarts" ref="refEcharts"> </div>
	</div>
</template>

<script>
	import * as echarts from 'echarts';
	export default {
		name: 'cuclife',
		data() {
			return {}
		},
		methods: {
			initCharts() {
				let myChart = echarts.init(this.$refs.refEcharts);
				myChart.setOption({
					title: {
						text: '标题:ECharts示例'
					},
					color: {
						type: 'radial',
						x: 0.1,                  // 0.5为正中心,如果小于渐变中心靠左
						y: 0.5,                  // 0.5为正中心,如果小于渐变中心靠上
						r: 1,                  // 0.5渐变影响范围只有一半,影响圆心到周围的一半
						colorStops: [{
							offset: 0, color: 'red' // 0% 处的颜色
						}, {
							offset: 1, color: 'blue' // 100% 处的颜色
						}],
						global: false // 缺省为 false
					},
					series: [{
						type: 'pie',
						radius: ['20%', '70%'],
						avoidLabelOverlap: false,
						label: {
							show: false,
							position: 'left'
						},
						data: [{
							name: 'cuclife',
							value: 100
						}, {
							name: '大剑师',
							value: 1000
						}],

					}]
				});
			}
		},
		mounted() {
			this.initCharts();
		}
	}
</script>
<style scoped>
	.container {
		width: 840px;
		height: 580px;
		margin: 50px auto 0;
		border: 1px solid rgb(228, 57, 97);
	}
	#vue-echarts {
		width: 800px;
		height: 460px;
		border: 1px solid #d8d;
		margin: 0 auto;
	}
</style>
阅读量:803
点赞量:0
收藏量:0
 JACKY
JACKY