【d3js】用d3js带你实现一个简易柱形图-灵析社区
 JOHO
JOHO前言
上周咱们实现了一个基础的折线图, 那么今天就领着大家实现一个基础的柱形图
效果展示
分析
- 柱状图也有坐标轴可以沿用之前的 折线图坐标轴方案
- 绘制出柱状图的柱子。
- 柱状图动画。
- 柱状图tooltip。
简易柱状图大致分为上面4个阶段绘制。
开始
先绘制出坐标轴
这块就不啰嗦了(有疑问看上一篇)直接使用坐标轴api开始绘制
<!DOCTYPE html>
<html lang="en">

<head>
    <meta charset="UTF-8">
    <meta http-equiv="X-UA-Compatible" content="IE=edge">
    <meta name="viewport" content="width=device-width, initial-scale=1.0">
    <title>Document</title>
</head>

<body>

</body>

</html>
<script src="https://d3js.org/d3.v5.min.js"></script>

<script>
    const data = [50, 100, 200, 300, 400, 150, 250, 350];

    const xS = d3.scaleBand().domain(['礼拜一', '礼拜二', '礼拜三', '礼拜四', '礼拜五', '礼拜六', '礼拜天']).range([0, 400]);
    const yS = d3.scaleLinear().domain([0, 400]).range([400, 0]);

    function initCanvas() {
        //定义画布空间
        d3.select('body')
            .append('svg')
            .attr('width', 500)
            .attr('height', 500)
            .attr('class', 'svg')
    }

    function drawX() {
        const xAxis = d3.axisBottom(xS)
            .ticks(7) //控制坐标轴上的刻度个数
            .tickSize(6) //控制刻度的大小
            .tickPadding(5) //设置标签数字与坐标轴的距离
            .tickFormat(d => d) //设置标签数字的格式

       d3.select('.svg').append('g')
       //平移到合适的位置(怎么才知道是合适位置?可以手动调整dom,或者脑袋里面构思下结构,大致就是能交汇就行了)
       .attr('transform','translate(50,430)')
       .call(xAxis)
    }


    function drawY() {
        const yAxis = d3.axisLeft(yS)
            .ticks(7) //控制坐标轴上的刻度个数
            .tickSize(6) //控制刻度的大小
            .tickPadding(5) //设置标签数字与坐标轴的距离
            .tickFormat(d => d) //设置标签数字的格式

       d3.select('.svg').append('g')
       //平移到合适的位置
       .attr('transform','translate(50,30)')
       .call(yAxis)
    }


    (async function() {
       await initCanvas();
       await drawX();
       await drawY();

    })();
</script>
效果呈现:
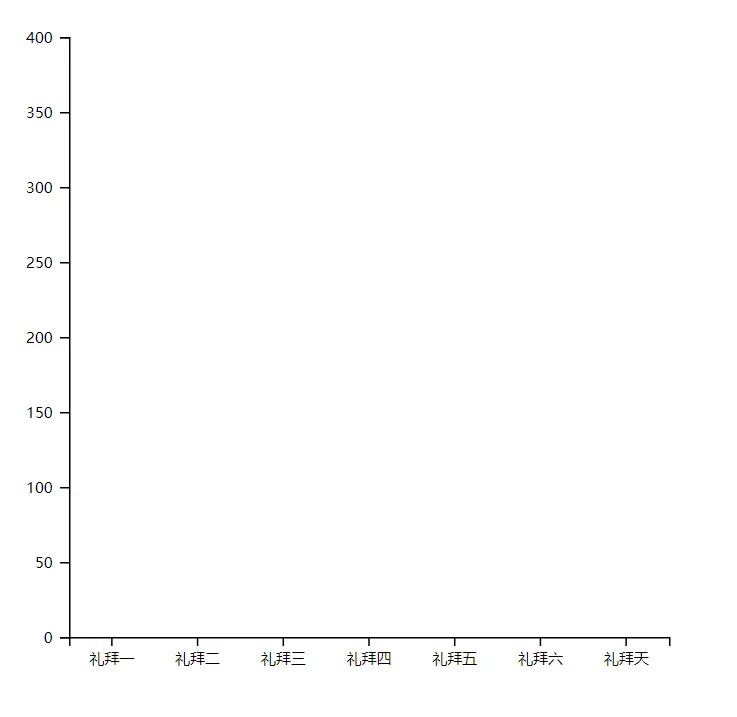
总结:initCanvas()函数定义画布空间,drawX()绘制x坐标轴,drawY()绘制y坐标轴,具体用法可以看下注释
绘制出柱状图的柱子
绘制柱子使用svg的rect绘制,位置坐标的话还是跟上篇折线图一致放在坐标轴生成的容器里面(下图dom)。
<!DOCTYPE html>
<html lang="en">
<head>
<meta charset="UTF-8">
<meta http-equiv="X-UA-Compatible" content="IE=edge">
<meta name="viewport" content="width=device-width, initial-scale=1.0">
<title>Document</title>
</head>
<body>
</body>
</html>
<script src="https://d3js.org/d3.v5.min.js"></script>
<script>
const data = [50, 100, 200, 300, 400, 150, 250, 350];
const xS = d3.scaleBand().domain(['礼拜一', '礼拜二', '礼拜三', '礼拜四', '礼拜五', '礼拜六', '礼拜天']).range([0, 400]);
const yS = d3.scaleLinear().domain([0, 400]).range([400, 0]);
function initCanvas() {
//定义画布空间
d3.select('body')
.append('svg')
.attr('width', 500)
.attr('height', 500)
.attr('class', 'svg')
}
function drawX() {
const xAxis = d3.axisBottom(xS)
.ticks(7) //控制坐标轴上的刻度个数
.tickSize(6) //控制刻度的大小
.tickPadding(5) //设置标签数字与坐标轴的距离
.tickFormat(d => {
return d
}) //设置标签数字的格式
d3.select('.svg').append('g')
.attr('transform', 'translate(50,430)')
.attr('class','x-axis')
.call(xAxis)
}
function drawY() {
const yAxis = d3.axisLeft(yS)
.ticks(7) //控制坐标轴上的刻度个数
.tickSize(6) //控制刻度的大小
.tickPadding(5) //设置标签数字与坐标轴的距离
.tickFormat(d => {
return d
}) //设置标签数字的格式
d3.select('.svg').append('g')
.attr('transform', 'translate(50,30)')
.attr('class','y-axis')
.call(yAxis)
}
function drawRect() {
//绘制柱状图的柱子 使用svg的rect标签绘制
//还是绘制再坐标轴生成得.tick容器里面 基点是x坐标轴的位置
//1. x = 0;
//2. y = -height;
//3. width = 20;
//4. height = data[i]个
d3.selectAll('.x-axis .tick')
.append('rect')
.attr('class', 'rect')
.attr('transform', `translate(-10, 0)`)
.attr('x', 0)
.attr('width',20)
.attr('height', (d, i) => data[i])
.attr('y', (d, i) => -data[i])
.attr('fill', '#2e6be6')
}
function drawText() {
//绘制柱状图的柱子文本
//还是绘制再坐标轴生成得.tick容器里面 基点是x坐标轴的位置
d3.selectAll('.x-axis .tick')
.append('text')
.attr('class', 'text')
.attr('transform', `translate(0, 0)`)
.attr('x', 0)
.attr('y', (d, i) => -data[i] - 5)
.text((d,i) => data[i])
.attr('fill', '#2e6be6');
}
(async function () {
await initCanvas();
await drawX();
await drawY();
await drawText();
await drawRect();
})();
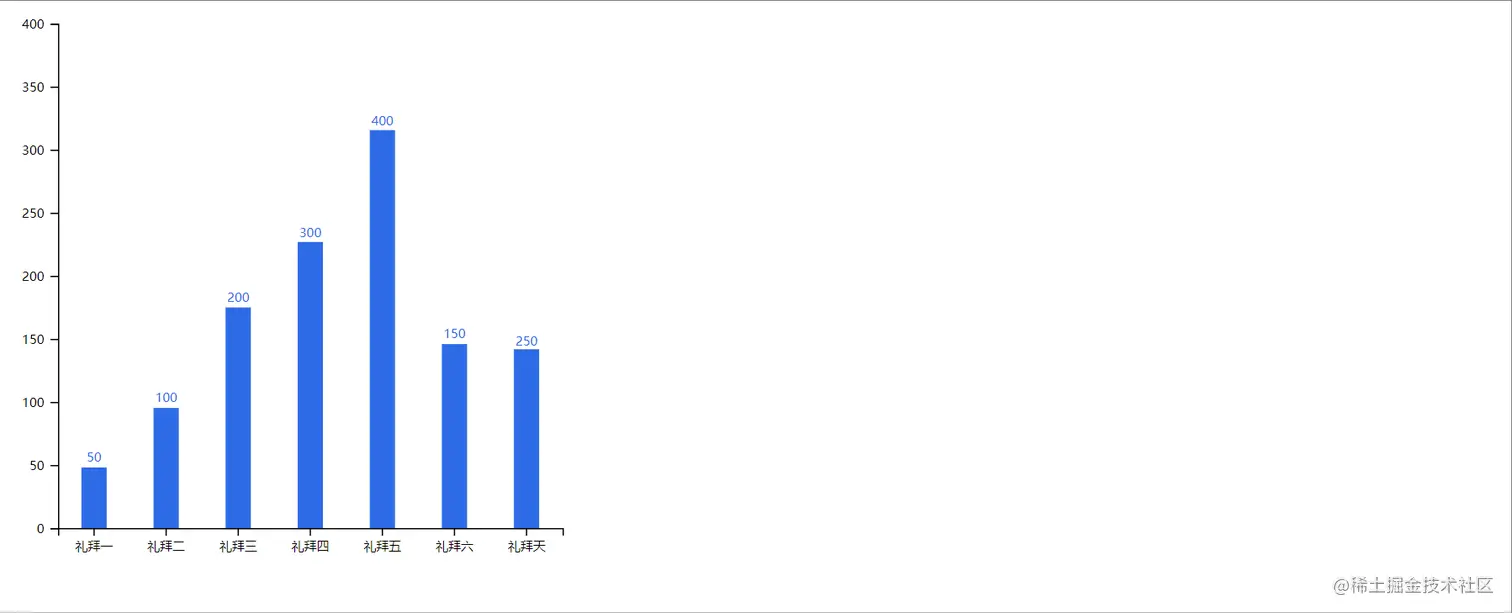
</script>效果图呈现:

总结:drawText()函数绘制柱形图柱子的文本,主要属性x是基于柱状图的x轴所以是0, y应该是柱状图柱子高度-5,让高于柱子。drawRect是绘制柱状图的柱子关键属性:x也是基于x轴坐标轴的所以是0,y应该是柱子高度的负数, width是给了固定值20为了让居中平移了translate(-10, 0),height也就是数据的高度
绘制柱状图的动画效果
再transition()篇中大家不知道对最后一个案例是否有印象(就是一个一个连续着滑动),柱状图的动画和那个类似,柱状图的动画是高度过渡。
代码示例:
<!DOCTYPE html>
<html lang="en">
<head>
<meta charset="UTF-8">
<meta http-equiv="X-UA-Compatible" content="IE=edge">
<meta name="viewport" content="width=device-width, initial-scale=1.0">
<title>Document</title>
</head>
<body>
</body>
</html>
<script src="https://d3js.org/d3.v5.min.js"></script>
<script>
const data = [50, 100, 200, 300, 400, 150, 250, 350];
const xS = d3.scaleBand().domain(['礼拜一', '礼拜二', '礼拜三', '礼拜四', '礼拜五', '礼拜六', '礼拜天']).range([0, 400]);
const yS = d3.scaleLinear().domain([0, 400]).range([400, 0]);
function initCanvas() {
//定义画布空间
d3.select('body')
.append('svg')
.attr('width', 500)
.attr('height', 500)
.attr('class', 'svg')
}
function drawX() {
const xAxis = d3.axisBottom(xS)
.ticks(7) //控制坐标轴上的刻度个数
.tickSize(6) //控制刻度的大小
.tickPadding(5) //设置标签数字与坐标轴的距离
.tickFormat(d => {
return d
}) //设置标签数字的格式
d3.select('.svg').append('g')
.attr('transform', 'translate(50,430)')
.attr('class', 'x-axis')
.call(xAxis)
}
function drawY() {
const yAxis = d3.axisLeft(yS)
.ticks(7) //控制坐标轴上的刻度个数
.tickSize(6) //控制刻度的大小
.tickPadding(5) //设置标签数字与坐标轴的距离
.tickFormat(d => {
return d
}) //设置标签数字的格式
d3.select('.svg').append('g')
.attr('transform', 'translate(50,30)')
.attr('class', 'y-axis')
.call(yAxis)
}
function drawRect() {
//绘制柱状图的柱子 使用svg的rect标签绘制
//还是绘制再坐标轴生成得.tick容器里面 基点是x坐标轴的位置
//1. x = 0;
//2. y = -height;
//3. width = 20;
//4. height = data[i]个
const rect = d3.selectAll('.x-axis .tick')
.append('rect')
.attr('class', 'rect')
.attr('transform', `translate(-10, 0)`)
.attr('x', 0)
.attr('width', 20)
.attr('height', 0) //为了动画先置为0
.attr('y', 0) //height过渡了y也要进行同样的过渡
.attr('fill', '#2e6be6')
rect.transition()
.duration(2000) //添加持续时间
.delay((d, i) => 200 * i) //持续过渡时间**叠加**
.ease(d3.easeBounce) //过渡效果
.attr('height', (d, i) => data[i])
.attr('y', (d, i) => -data[i])
}
function drawText() {
//绘制柱状图的柱子文本
//还是绘制再坐标轴生成得.tick容器里面 基点是x坐标轴的位置
const text = d3.selectAll('.x-axis .tick')
.append('text')
.attr('class', 'text')
.attr('transform', `translate(0, 0)`)
.attr('x', 0)
.attr('y', 0)
.text((d, i) => data[i])
.attr('fill', '#2e6be6');
//text也要进行相应的过渡
text.transition()
.duration(2000) //添加持续时间
.delay((d, i) => 200 * i) //持续过渡时间**叠加**
.ease(d3.easeBounce) //过渡效果
.attr('y', (d, i) => -data[i] - 5)
}
(async function () {
await initCanvas();
await drawX();
await drawY();
await drawText();
await drawRect();
})();
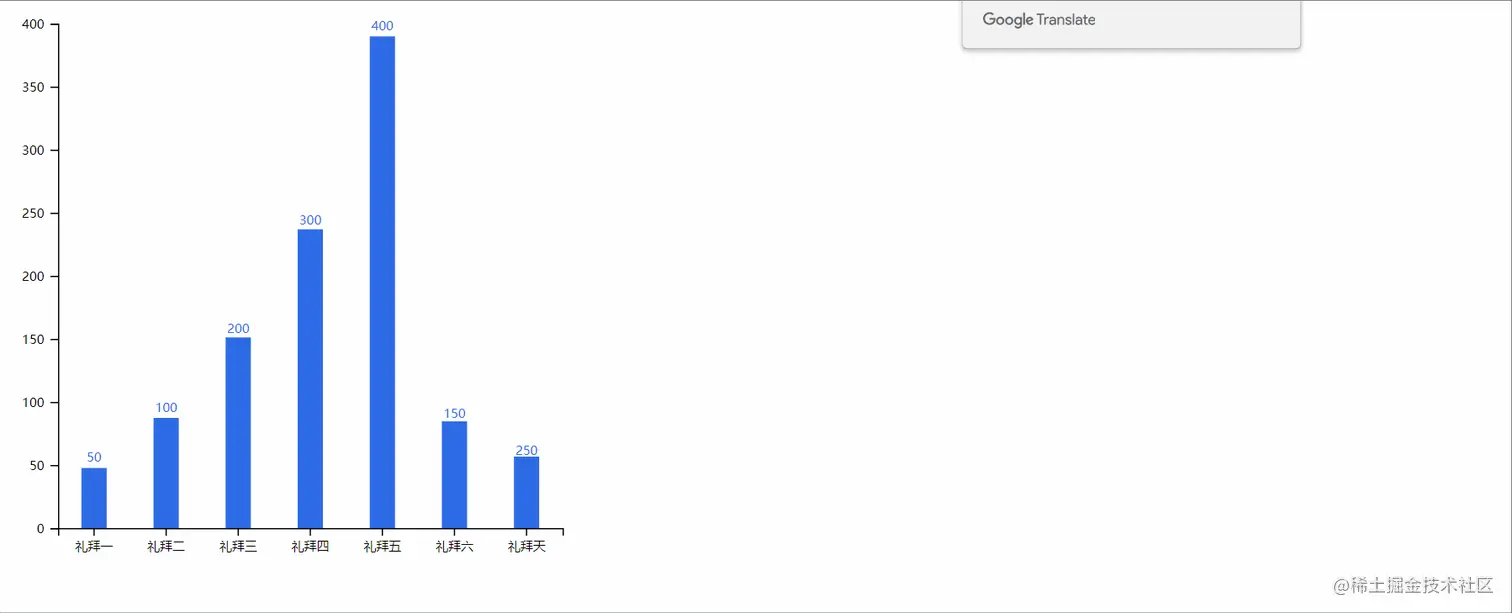
</script>效果展示:
总结:改造drawText()函数使文本添加过渡动画效果,主要过渡y,从0过渡到-data[i] - 5,delay使持续性叠加的。改造drawRect()函数给柱状图的柱子添加动画过渡效果,主要也是过渡height,不过因为y是跟height相关的,所以要一块过渡了。
给柱状图添加一个小tooltip
添加tooltip, 首先想到的是mouseover和mouseout, 用on给d3添加事件吧!!!
<!DOCTYPE html>
<html lang="en">

<head>
    <meta charset="UTF-8">
    <meta http-equiv="X-UA-Compatible" content="IE=edge">
    <meta name="viewport" content="width=device-width, initial-scale=1.0">
    <title>Document</title>
</head>

<body>

</body>

</html>
<script src="https://d3js.org/d3.v5.min.js"></script>

<script>
    const data = [50, 100, 200, 300, 400, 150, 250, 350];

    const xS = d3.scaleBand().domain(['礼拜一', '礼拜二', '礼拜三', '礼拜四', '礼拜五', '礼拜六', '礼拜天']).range([0, 400]);
    const yS = d3.scaleLinear().domain([0, 400]).range([400, 0]);

    function initCanvas() {
        //定义画布空间
        d3.select('body')
            .append('svg')
            .attr('width', 500)
            .attr('height', 500)
            .attr('class', 'svg')
    }

    function drawX() {
        const xAxis = d3.axisBottom(xS)
            .ticks(7) //控制坐标轴上的刻度个数
            .tickSize(6) //控制刻度的大小
            .tickPadding(5) //设置标签数字与坐标轴的距离
            .tickFormat(d => {
                return d
            }) //设置标签数字的格式

        d3.select('.svg').append('g')
            .attr('transform', 'translate(50,430)')
            .attr('class', 'x-axis')
            .call(xAxis)
    }


    function drawY() {
        const yAxis = d3.axisLeft(yS)
            .ticks(7) //控制坐标轴上的刻度个数
            .tickSize(6) //控制刻度的大小
            .tickPadding(5) //设置标签数字与坐标轴的距离
            .tickFormat(d => {
                return d
            }) //设置标签数字的格式

        d3.select('.svg').append('g')
            .attr('transform', 'translate(50,30)')
            .attr('class', 'y-axis')
            .call(yAxis)
    }


    function drawRect() {
        //绘制柱状图的柱子 使用svg的rect标签绘制
        //还是绘制再坐标轴生成得.tick容器里面 基点是x坐标轴的位置
        //1. x = 0;
        //2. y = -height;
        //3. width = 20;
        //4. height = data[i]个
        const rect = d3.selectAll('.x-axis .tick')
            .append('rect')
            .attr('class', 'rect')
            .attr('transform', `translate(-10, 0)`)
            .attr('x', 0)
            .attr('width', 20)
            .attr('height', 0) //为了动画先置为0
            .attr('y', 0) //height过渡了y也要进行同样的过渡
            .attr('fill', '#2e6be6')
            .attr('cursor','pointer')

        rect.transition()
            .duration(2000) //添加持续时间
            .delay((d, i) => 200 * i) //持续过渡时间**叠加**
            .ease(d3.easeBounce) //过渡效果
            .attr('height', (d, i) => data[i])
            .attr('y', (d, i) => -data[i])

    }

    function drawText() {
        //绘制柱状图的柱子文本
        //还是绘制再坐标轴生成得.tick容器里面 基点是x坐标轴的位置
        const text = d3.selectAll('.x-axis .tick')
            .append('text')
            .attr('class', 'text')
            .attr('transform', `translate(0, 0)`)
            .attr('x', 0)
            .attr('y', 0)
            .text((d, i) => data[i])
            .attr('fill', '#2e6be6');

        //text也要进行相应的过渡
        text.transition()
            .duration(2000) //添加持续时间
            .delay((d, i) => 200 * i) //持续过渡时间**叠加**
            .ease(d3.easeBounce) //过渡效果
            .attr('y', (d, i) => -data[i] - 5)
    }

    //添加事件
    function addRectEvent() {
        d3.selectAll('.x-axis .tick .rect')
            .on('mouseover', (d, i) => {
                //绘制一个十字交错的tip, 也是往tick里面添加,就不用关心坐标位置的。

                //+2的目的是:nth-child是重1开始的,然后在咱们的dom结构中第一个是一个path
                //绘制横坐标
                d3.selectAll(`.x-axis .tick:nth-child(${i + 2})`)
                    .append('line')
                    .attr('class', 'tip-line')
                    .attr('x1', 0)
                    .attr('y1', 0)
                    .attr('x2', 0)
                    .attr('y2', -430)
                    .attr('stroke', '#3e3e3e');

                d3.select(`svg`)
                    .append('line')
                    .attr('class', 'tip-line')
                    .attr('x1', 50)
                    .attr('y1', d3.event.clientY)
                    .attr('stroke-dasharray', '2')
                    .attr('x2', 440)
                    .attr('y2', d3.event.clientY)
                    .attr('stroke', '#3e3e3e');

                d3.select(`svg`)
                    .append('text')
                    .attr('width', '100')
                    .attr('height', '50')
                    .attr('fill', 'red')
                    .attr('class', 'tip-line')
                    .attr('x', d3.event.clientX)
                    .attr('y', d3.event.clientY)
                    .text((d) => data[i])
            })
            .on('mouseout', () => {
                d3.selectAll('.tip-line').remove();
            })
    }

    (async function () {
        await initCanvas();
        await drawX();
        await drawY();
        await drawText();
        await drawRect();
        await addRectEvent();
    })();
</script>
效果图展示:

总结:新增addRectEvent()函数,添加事件用on关键字。d3.event是获取当前的事件,类似于js中的event事件,里面有当前鼠标位置的一些信息
总结
咱们这次用d3.transition()给柱状图添加了过渡动画效果,用on关键字给咱们的柱状图添加了事件,用d3.event获取当前鼠标的位置信息
如果想把tooltip改成跟echarts样的你会改吗?留给大家😀
阅读量:585
点赞量:0
收藏量:0