【d3js(四)】刻度尺、format、坐标轴-灵析社区
 JOHO
JOHO前言
在上一篇咱们说到d3比例尺,那么咱们就用它来画一个坐标轴,就是柱形图或者折线图的坐标轴。d3也有对应的方法方便咱们绘制这些坐标轴。
效果呈现:

咱们先大致了解下d3.format()吧 等会会用到,不能让大家产生疑问。
开始
d3.format
<!DOCTYPE html>
<html lang="en">
<head>
    <meta charset="UTF-8">
    <meta name="viewport" content="width=device-width, initial-scale=1.0">
    <meta http-equiv="X-UA-Compatible" content="ie=edge">
    <title>format</title>
    <script src="https://d3js.org/d3.v5.min.js"></script>
</head>
<body>
    <!--
        格式化数字是不经常用到的,只有在例如丑陋的"0.30000000000000004"出现在你的数轴标签上时,
        或者你想要使用固定精度将几千的数字组织为更加可读的形式,例如"$1,240.10",
        再或者你可能只想展示一个特定的数字的显著位。
        D3使用标准的数字格式化使得一切变得简单,例如,创建一个用0补齐4位数字的函数,可以这样:
     -->

</body>
</html>
<script>
  let zero=d3.format('04d');
  console.log(zero(2),zero(123),'zero',d3.format(".1")(42))

  /**
   * https://github.com/d3/d3-format  api地址
   * d3.format(".0%")(0.123);  // rounded percentage, "12%"
    d3.format("($.2f")(-3.5); // localized fixed-point currency, "(£3.50)"
    d3.format("+20")(42);     // space-filled and signed, "                 +42"
    d3.format(".^20")(42);    // dot-filled and centered, ".........42........."
    d3.format(".2s")(42e6);   // SI-prefix with two significant digits, "42M"
    d3.format("#x")(48879);   // prefixed lowercase hexadecimal, "0xbeef"
    d3.format(",.2r")(4223);  // grouped thousands with two significant digits, "4,200"
    d3.format("s")(1500);  // "1.50000k"
    d3.format("~s")(1500); // "1.5k"
    d3.format(".2")(42);  // "42"
    d3.format(".2")(4.2); // "4.2"
    d3.format(".1")(42);  // "4e+1"
    d3.format(".1")(4.2); // "4"
  */
</script>
刻度api
刻度: ticks() 、tickSize() 、tickPadding()、 tickFormat() ticks(10) 设置刻度的个数为10 tickSize(12) 设置刻度的长度为12px,默认6px tickPadding(12) 设置刻度与数值之间的间隙为12px tickFormat(d3.format(".0%")) 设置刻度下的数值的格式

坐标轴
v3中 定义坐标轴是
d3.svg.axis().orient('bottom'/'left'/'top'/'right')orient()里面是定义坐标轴刻度的方向。 v4中是 d3.axisBottom()/axisLeft()....
绘制一个坐标轴
<!DOCTYPE html>
<html lang="en">
<head>
<meta charset="UTF-8">
<meta name="viewport" content="width=device-width, initial-scale=1.0">
<meta http-equiv="X-UA-Compatible" content="ie=edge">
<title>axis/orient</title>
<script src="https://d3js.org/d3.v5.min.js"></script>
</head>
<body>
<div class="learn-tick">
</div>
</body>
</html>
<script>
/**
*
* v3中 定义坐标轴是 d3.svg.axis().orient('bottom'/'left'/'top'/'right')
* orient()里面是定义坐标轴刻度的方向
*
* v4中是 d3.axisBottom()/axisLeft()....
*/
const svgWidth = 400
const svgHeight = 400
const padding = { top:20, bottom:20, left:40, right:40 }
const xAxisLength = svgWidth- padding.left- padding.right;
const svg = d3.select(".learn-tick")
.append("svg")
.attr("width",svgWidth)
.attr("height",svgHeight);
const scale = d3.scaleLinear() //线性比例尺
.domain([0,1])
.range([0,xAxisLength])
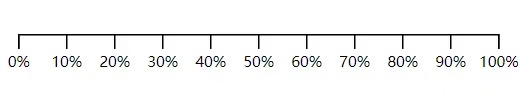
const axis = d3.axisBottom(scale)
.ticks(10) //控制坐标轴上的刻度个数
.tickSize(10) //控制刻度的大小
.tickPadding(5) //设置标签数字与坐标轴的距离
.tickFormat(d3.format(".0%")) //设置标签数字的格式
svg.append("g")
.attr("class","axis")
.call(axis)
</script>效果呈现:
dom结构呈现都是api帮咱们生成的dom呢,咱们就调用了下坐标轴的api,还不赶快去试试!!!

总结
这篇文章讲到了怎么绘制坐标轴,其实用d3js的api真的很方便不是。那该有人问了是不是接下来该绘制柱形图或者折线图了。是,马上给奉上 下篇
阅读量:759
点赞量:0
收藏量:0